Create a hypothesis for the Happiness and Engagement Dataset from Part 1 of the Statistics Project.
Now that you have run descriptive statistics with your data, it is time to create a hypothesis and test your hypothesis. This part of the Statistics Project will take you through the process of creating and testing your hypothesis through statistical methods, using Microsoft® Excel®. Creating hypotheses provides you the opportunity to think like a researcher and help you understand and critique research articles you read.
Create a hypothesis for the Happiness and Engagement Dataset from Part 1 of the Statistics Project. Your hypothesis can be anything based on the variables you have in your dataset. One example: Teaching Method X provides higher test scores than Teaching Method Y.
Create a null hypothesis. (Example: Teaching Method X scores are equal to Teaching Method Y scores.)
State your null and alternate hypotheses.
Identify and justify which type of statistical analysis will be appropriate for this data.
Review the steps beginning on pp. 202 in Statistics Plain and Simple describing how to run an independent samples t test.
Run an independent samples t test on the data in your dataset.
Write a 125- to 175-word summary of your interpretation of the results of the t test, and copy and paste your Microsoft® Excel® output below the summary.
Running Head: Descriptive Statistics 0Statistics Project, Part 1: Opening Data in Microsoft® Excel® and Running Descriptive Statistics
Nasser Y Miranda
University of Phoenix
August 4th, 2018
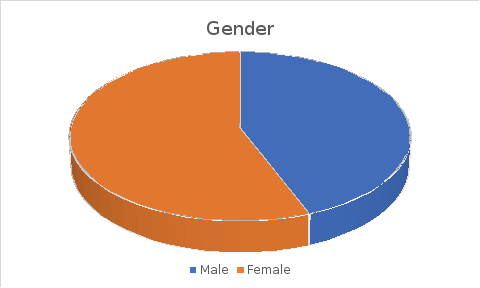
Gender
The dataset consists of 50 individuals where 22 are males and 28 females. Below is the pie chart graph that graphically represent the gender composition. In terms of percentage, the males 44% are whereas the females are 56%. This is an indication that the data sample used was relatively balanced in terms of gender. Atkinson-Bonasio (2017) asserts that in research, fostering diversity achieved by gender equality assures innovation. She further states that bias and gender disparity should be examined so as to ensure a data-informed approach especially to implementing policies and interventions related to gender inequality.
| Variable | Mean | Median | Mode |
| Gender |
The above table shows that the mode of the gender is 2. In this case, it implies that the females are frequently occurring in the data when compared to the males which is proved clearly by their percentage.
Age
| Variable | Mean | Median | Mode | Standard Deviation | Variance | Range |
| Age | 32.02 | 31.5 | 29 | 4.340083701 | 18.83633 | 15 |
The individuals used in this case age has an average of 32 years where those of 29 years of age are the frequently occurring. The range of the populations is 15 years which shows the difference of years between the youngest individual and the oldest individual in the data set. The age has a high deviation showing the high variance of the data from the mean which is confirmed by the high variance of 18.83633.
Relationship with Direct Supervisor
This variable is data is further labelled into 4 categories namely: 1 = negative relationship, 2 = neutral relationship, 3 = positive relationship, 4 = great relationship.
| Variable | Mean | Median | Mode | Standard Deviation | Variance | |
| Supervisor | 2.5 | 1.015190743 | 1.030612 |
The above table indicates that the average relationship for all the 50 individuals with their direct supervisor is 2.5 which is between neutral relationship and positive relationship. Most of the individuals have a positive relationship with their direct supervisor. The mode of 3 shows that majority of the individuals have a positive relationship with their direct supervisor. The relationship categories does not exhibit great variance from what is expected thus the low case of 11 individuals out of 50 who have a negative relationship with their direct supervisor.
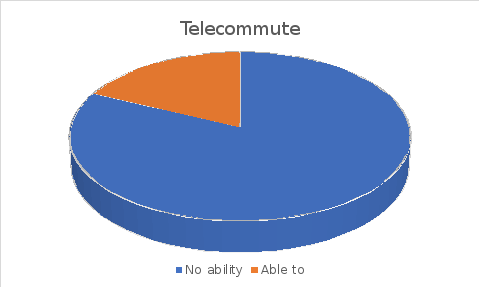
Telecommute Schedule
The telecommute schedule variable is categorized as follows: 1= no ability to telecommute, 2 = able to telecommute at least 2 days per week.
| Variable | Mean | Median | Mode | Standard Deviation | Variance | Range |
| Telecommute | 1.18 | 0.388087934 | 0.150612 |
The table above shows that majority of the individuals have no ability to telecommute as opposed to those who those who have the ability to do so at least 2 day every week.
| Telecommute Percentage | |
| No ability | 82 |
| Able to | 18 |
82% have no ability to telecommute while on the other hand only 18% are able to. This is a clear indication that majority of the individuals have no access to Internet access, email and telephone from their homes. It is therefore not necessary to consider giving them tasks that will need them to be telecommunicating since most of them will not be able to deliver. Jafroodi, Salajeghe & Kiani (2015) in their paper found out that telecommuting is one of the factors that lead to increased productivity and employee satisfaction scores among others is telecommuting.
Relationship with Coworkers
This variable is categorized into the following: 1 = negative relationship, 2 = no relationship, 3 = positive relationship
| Variable | Mean | Median | Mode | Standard Deviation | Variance | Range | |
| Coworkers | 1.92 | 0.665168384 | 0.442449 |
The above table shows the relationship these individuals in the dataset had with their fellow coworkers. From the table, the average relationship is closer to being neutral in the sense that most people have no relationship with their coworkers. This is clearly seen in the mode where majority of these individuals who frequently occur in the dataset, 28 to be precise, have no relationship with their coworkers whatsoever. Only 9 out of the 50 have a positive relationship with their coworkers. This calls for the organization to strive and make it their goal to increase the number of individuals who have a positive relationship with their workers. Positive relationships between colleagues are very beneficial to both the individuals and organization in terms of improved teamwork, increased productivity, high rates of employee retention, and so on (Dutton & Ragins, 2017).
Workplace Happiness Rating
This variable is categorized as follows: Scale 0-10, 0 = no happiness, 10 = completely happy
| Variable | Mean | Median | Mode | Standard Deviation | Variance | Range |
| Happiness | 7.4 | 1.414213562 |
From the above table, the average rate of happiness is relatively high showing that most of the individuals are happy in their workplace. The table further indicates that the happiness score frequently occurring is 8 out of 10 which suggests that most of the people are happy. However, it seems like the company has to go an extra mile since there more room for improvement. There is a need to identify the reason why there are still other who are not that much happy in order to know which areas the company needs to work on. One of the most important things companies are striving to have is keeping retaining employees while at the same time keeping them happy and productive (Hsiao, 2015). Loyal employees perform better, meet their deadlines, and most importantly are very supportive and open to new ideas and changes which means a lot to companies.
Workplace Engagement Rating
This variable is categorized into the following: Scale 0-10, 1 = no engagement, 10 = highly engaged
| Variable | Mean | Median | Mode | Standard Deviation | Variance | Range |
| Engagement | 7.64 | 1.241460628 | 1.541224 |
The table above shows that the individuals have an average score of 7.64 out of 10 level of engagement in the workplace. Many people are actively engaged since the most frequent occurring score is 8 out of 10. The range is relatively higher indicating that the dataset contains a significant difference between those actively engaged and those not that much engaged. Sorting the workplace engagement rating shows that only a few of the individuals are not engaged much. Companies that gain higher profits have employees who are highly engaged, motivated and valued. The passively engaged can be encouraged to be engaged by being inspired, recognized, being given flexible working hours as well as being given a fair pay structure.
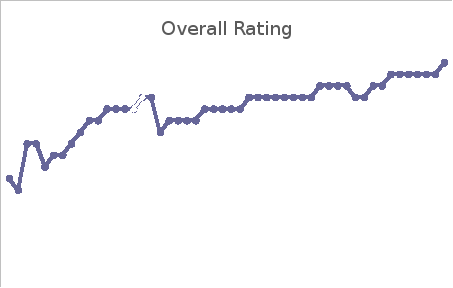
Overall Rating
This variable is categorized into the following: Scale 0-20, 0 = not happy and not engaged, 20 = completely happy and highly engaged.
| Variable | Mean | Median | Mode | Standard Deviation | Variance | Range | |
| Overall Rating | 15.02 | 15.5 | 16 | 2.428487394 | 5.897551 | 11 | |
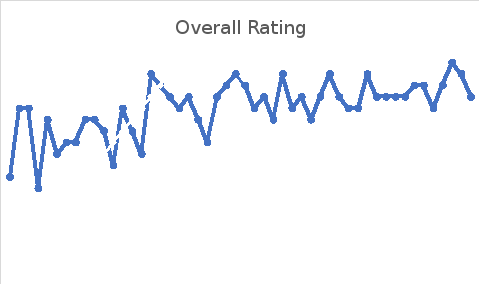
The table above show that the mean score is 15.02 out of 20 implying that majority of the individuals are happy and highly engaged. This however, shows that there is more the company has to do in order to raise overall employee rating score. The range of 11 shows that the level of happiness and commitment in the department is varying in the sense that there is a high variance between those that are completely happy and highly engaged and those that are not. This calls for diversity in the department which would bring diverse people with regard to culture, religion, talent, background and exposure which bring many benefits through the diverse pool of people brought together. Team work is also enhanced in the sense that people are given tasks according to their areas of strengths.
References
Atkinson-Bonasio, A. (2017). Gender balance in research: new analytical report reveals uneven progress. Retrieved from https://www.elsevier.com/connect/gender-balance-in-research-new-analytical-report-reveals-uneven-progress
Dutton, J. E., & Ragins, B. R. (2017). Positive relationships at work: An introduction and invitation. In Exploring positive relationships at work (pp. 2-24). Psychology Press.
Hsiao, W. J. (2015). Happy Workers Work Happy? The Perspective of Frontline Service Workers. In Industrial Engineering, Management Science and Applications 2015 (pp. 473-476). Springer, Berlin, Heidelberg.
Jafroodi, N. R., Salajeghe, S., & Kiani, M. P. (2015). Comparative analysis of the effect of organizational culture characteristics on telecommuting system strategy through inferential statistics and rough set theory.
| Supervisor | Telecommute | Coworkers | Happiness | Engagement | Overall Rating | Variable | Mean | Median | Mode | Standard Deviation | Variance | Range | |
| Gender | 0.254693878 | ||||||||||||
| Age | 32.02 | 31.5 | 29 | 4.340083701 | 18.83632653 | 15 | |||||||
| 12 | Supervisor | 2.5 | 1.015190743 | 1.030612245 | |||||||||
| 12 | Telecommute | 1.18 | 0.388087934 | 0.150612245 | |||||||||
| 10 | Coworkers | 1.92 | 0.665168384 | 0.44244898 | |||||||||
| 11 | Happiness | 7.4 | 1.414213562 | ||||||||||
| 11 | Engagement | 7.64 | 1.241460628 | 1.54122449 | |||||||||
| 12 | Overall Rating | 15.02 | 15.5 | 16 | 2.428487394 | 5.89755102 | 11 | ||||||
| 13 | |||||||||||||
| 14 | Gender Percentage | ||||||||||||
| 14 | Male | 44 | |||||||||||
| 15 | Female | 56 | |||||||||||
| 15 | Telecommute Percentage | ||||||||||||
| 15 | No ability | 82 | |||||||||||
| 15 | Able to | 18 | |||||||||||
| 16 | |||||||||||||
| 16 | |||||||||||||
| 13 | |||||||||||||
| 14 | |||||||||||||
| 14 | |||||||||||||
| 14 | |||||||||||||
| 14 | |||||||||||||
| 15 | |||||||||||||
| 15 | |||||||||||||
| 15 | |||||||||||||
| 15 | |||||||||||||
| 15 | |||||||||||||
| 16 | |||||||||||||
| 16 | |||||||||||||
| 16 | |||||||||||||
| 16 | |||||||||||||
| 16 | |||||||||||||
| 16 | |||||||||||||
| 16 | |||||||||||||
| 16 | |||||||||||||
| 17 | |||||||||||||
| 17 | |||||||||||||
| 17 | |||||||||||||
| 17 | |||||||||||||
| 16 | |||||||||||||
| 16 | |||||||||||||
| 17 | |||||||||||||
| 17 | |||||||||||||
| 18 | |||||||||||||
| 18 | |||||||||||||
| 18 | |||||||||||||
| 18 | |||||||||||||
| 18 | |||||||||||||
| 18 | |||||||||||||
| 10 | 19 | ||||||||||||